Posts Tagged ‘data’

Extreme Sailing with SAP is Easy – 세일링은 쉽다

Sunday, February 23rd, 2014

The Extreme Sailing Series has just completed the races at its first venue for 2014 in Singapore. There will be seven more venues coming up before the eventual winner is decided.

멀라이언쿠기 (Merlion Cookie) was invited to be the sixth sailor on the catamaran of the SAP Extreme Sailing Team during one of the races. She shares her experience and understanding of how SAP data analytics contribute towards the rigours of extreme racing.

* All the pictures in this article were provided by Merlion Cookie. This journal is dedicated to the Korean readers out there 🙂

A day out with SAP Extreme Sailing Team

A day out with SAP Extreme Sailing Team

세일링은 쉽다. 응? 세일링이 무엇인지도 잘 몰랐던 내가 이제 세일링이 쉽다. SAP Extreme Sailing팀과 경험한 세일링은 그렇다.

“We are committed to transforming the sport of sailing globally by developing tools that help sailors optimize their performance, bring fans closer to the action and enable media and broadcasters to provide better informed commentaries,” said Stefan Lacher, head of Technology, SAP Sponsorships.

2014년 2월 20일에서 23일까지 나흘동안 싱가폴 마리나베이를 배경으로 전세계에서 온 11개 팀의 카타마란 경주를 펼치는데, 경주는 하루에도 몇 개의 라운드를 걸쳐 진행되며 결과적으로 각라운드의 점수합이 가장 높은 팀이 승리를 하게 된다.

나는 이 중 세번째 라운드 경주에 직접승선하여 바람을 가르는 세일링의 짜릿함을 온몸으로 느끼고 돌아왔다. 카타마란이 뭔지도 모랐었던 내가 어떻게 세일링과 친한게 되었을까?

우선 카타마란이 무엇인지 알아야겠다. 카타마란은 두 개 선채가 연결된 모양을 하고 있으며 그 위에 세운 돛으로 풍력을 이용하여 진행하는 배를 말한다. 즉, 돛을 세우고 바람을 받아가는 배 인 것이다.

(more…)

SAP data analytics empowers teams in Extreme Sailing Series

Thursday, February 20th, 2014

The Extreme Sailing Series is in Singapore as the first of 8 international venues for some 260 races this year. 12 teams will be vying to be leaders over four days from today till 23 February, at the Marina Bay.

I joined the SAP Extreme Sailing Team as a guest in their 40 Catamaran during one of the races on the opening day to experience the thrills and challenges of extreme sailing.

The participating multihulls racing against the backdrop of the Singapore skyline at Marina Bay, as the sun sets at the end of a successful first day. Taken with a Samsung GALAXY Note 3. Photo credit: John Tan.

The participating multihulls racing against the backdrop of the Singapore skyline at Marina Bay, as the sun sets at the end of a successful first day. Taken with a Samsung GALAXY Note 3. Photo credit: John Tan.

With things happening so fast and with so many variables changing at the same time, it is easy to see how SAP’s data analytics is an invaluable tool in helping the teams and the coaches squeeze as much performance as possible out of every race.

As in other complex competitive sports such as Formula One racing, a multitude of factors contribute to the success of a participating team.

These variables can also make it confusing and daunting for the spectator to follow and fully appreciate how the race is unfolding.

This is because there is simply too much information assaulting the brain of anyone trying to fully understand why a team they support is falling behind or why a rival is pulling ahead.

The SAP Extreme Sailing Team, with the Singapore Marina Bay Sands hotel in the background. Taken with a Samsung GALAXY Note 3. Photo credit: John Tan.

The SAP Extreme Sailing Team, with the Singapore Marina Bay Sands hotel in the background. Taken with a Samsung GALAXY Note 3. Photo credit: John Tan.

(more…)

Infographic: SAP crunches the numbers on Valentine’s Day

Thursday, February 13th, 2014

SAP wishes you a happy Valentine’s Day!

SAP's infographic for Valentine's Day.

SAP’s infographic for Valentine’s Day.

Below are six interesting findings highlighted by SAP.

  1. Singapore is the biggest importer of flowers in comparison to 8 other markets, topping the list with an average spend of USD6.85 of flower imports per capita.
  2. Singapore tops the list again for the highest cocoa imports for chocolate and food preparations, with an average spend of USD 12.60 per capita. Separately, did you know that SAP customers produce 70 percent of the world’s chocolate and distribute more than 71 percent of the world’s food?
  3. Korea consumes 14.8 liters of alcohol per capita, the highest in the region ahead of Australia (10 liters) and New Zealand (9.6 liters). Also, SAP customers produce 64 percent of the world’s ice cream and 72 percent of the world’s beer.
  4. Hong Kong residents are the biggest spenders on tourism per capita ahead of 9 other markets.
  5. Korea has the highest divorce rates per person (2.2%), followed by Australia (2.2%), Singapore (1.9%) and New Zealand (1.9%).
  6. 62% of Indonesians have started retirement planning while only 29% of Japanese started retirement planning.

This infographic is created with the generation Y consumers in mind who are more inquisitive than ever before.

(more…)

Red Hat signs MOU with A*STAR BATC on Data Analytics Development

Tuesday, October 1st, 2013

A*STAR’s Business Analytics Translational Centre (BATC) collaborates with Red Hat to Use open source solutions for data analytic applications development.

Witnesses and signing parties of the MOU collaboration between Red Hat and A*STAR’s Business Analytics Translational Centre. From L-R: Ang Wee Tiong, Director, Technology, BATC; Dr. Tan Geok Leng, Executive Director, Science & Engineering Research Council, A*STAR & Chairman, BATC Management Committee; Damien Wong, General Manager, ASEAN, Red Hat; Suresh Sachi, Deputy Managing Director (Corporate & Legal), General Counsel, A*STAR; Jim Whitehurst, President and CEO, Red Hat; Dr. Vivian Balakrishnan, Minister for the Environment and Water Resources; Jacqueline Poh, Managing Director, IDA; Shankha Sen, Chief Financial Officer, Red Hat Asia Pacific.

Witnesses and signing parties of the MOU collaboration between Red Hat and A*STAR’s Business Analytics Translational Centre. From L-R: Ang Wee Tiong, Director, Technology, BATC; Dr. Tan Geok Leng, Executive Director, Science & Engineering Research Council, A*STAR & Chairman, BATC Management Committee; Damien Wong, General Manager, ASEAN, Red Hat; Suresh Sachi, Deputy Managing Director (Corporate & Legal), General Counsel, A*STAR; Jim Whitehurst, President and CEO, Red Hat; Dr. Vivian Balakrishnan, Minister for the Environment and Water Resources; Jacqueline Poh, Managing Director, IDA; Shankha Sen, Chief Financial Officer, Red Hat Asia Pacific.

Red Hat, Inc., a leading provider of open source solutions, today announced plans for a new collaboration with A*STAR’s Business Analytics Translational Centre (BATC) to help accelerate innovation and drive adoption of business analytics with open source solutions from Red Hat.

“Open source has evolved to become a foundation for innovation. As technology continues to become more of a commodity, the standardization of parts can help spur more rapid innovation,” said Jim Whitehurst, president and CEO of Red Hat.

Jim Whitehurst, president and CEO of Red Hat, was present for the signing of a Memorandum of Understanding (MOU) today in Singapore with Dr Tan Geok Leng, Chairman of BATC Management Committee and Executive Director for the Science & Engineering Research Council (SERC), A*STAR.

Red Hat will be collaborating with BATC in areas of big data, middleware, Platform-as-a-service (PaaS), cloud and storage, for the innovation and development of current and upcoming analytics projects.

(more…)

Smartphones hungrier than tablets for data utilisation – Arieso says

Monday, January 14th, 2013

Arieso has just released the results of a study into recent trends in extreme data, revealing new challengers for Telcos and network operators.

The latest Hungry Handsets report by Arieso

The latest Hungry Handsets report by Arieso

This year’s Hungry Handsets study finds that:

  • Smartphones trump tablets in terms of data consumption and generation
  • Apple’s iPhone 5 and Samsung’s GALAXY SIII goes head to head against each other at the top of the data utilisation list
  • Data upload has grown, as users generate more data.

This latest analysis by Arieso into mobile data use also reveals that 40% of all data is consumed by only 1% of users, although LTE is starting to take the strain.

Interview with study author

Dr. Michael Flanagan, study author & CTO, Arieso

Dr. Michael Flanagan, study author & CTO, Arieso

I spoke with Dr. Michael Flanagan, the study author and Arieso CTO about the report.

He observed that the data crunch in the wireless industry started by the launch of the iPhone was not abating; and the study revealed that increasingly sophisticated devices are unleashing unprecedented levels of user demand.

He cautioned that the particular results in this study corresponded to the specific market that was studied, and that these results could vary depending on a number of circumstances (including morphologies, available devices, regional customer behaviors, and socio-economic user factors).

“Yet again we found that novel usage patterns, new technologies and regional idiosyncrasies are conspiring to make life increasingly difficult for mobile operators trying to meet evolving customer expectations,” said study author and Arieso CTO, Dr. Michael Flanagan.

As such, these results are intended to be illustrative rather than definitive.

Dr. Flanagan urged network operators to embark upon similar subscriber and network evaluation programs in order to determine the clear and present data demands being placed on their networks as well as the most appropriate response strategies to best satisfy this demand.

(more…)

The Disaster Recovery Survey 2012: Asia Pacific and Japan

Tuesday, May 8th, 2012

81% of businesses in the Asia Pacific and Japan might NOT be able to recover lost data and systems in the event of a disaster. New independent research sponsored by EMC points to outdated backup and recovery infrastructure.

EMC Research: "The Disaster Recovery Survey 2012: Asia Pacific and Japan"

The survey also found that 71% of all organizations had lost data or suffered systems downtime in the last 12 months.

These findings highlight the need for backup transformation from antiquated technologies that are not suited for today’s data growth or availability expectations.

A move to next-generation backup and recovery solutions ensure continued business operations in the event of a natural disaster, malicious activity or more routine and common disruptions to IT systems.

In fact, the research showed that the causes of systems downtime are often the commonplace disruptions to IT, such as hardware failure or data corruption, rather than natural disasters or other major incidents.

Other key findings are summarised below:

  • Hardware failure (60%), data corruption (49%) and loss of power (44%) were cited as the primary causes of data loss and downtime.
  • 42% of organizations cite loss of employee productivity as the most likely consequence of data loss and downtime.
  • 44% of organizations who store a backup copy offsite for disaster recovery still use tape for recovery, and 37% still use CD ROM (although 62% now use disk-based storage).
  • 83% of these organizations want to replace tape all together, highlighting the need for next generation backup and recovery.

Commissioned by EMC and conducted by independent research company Vanson Bourne, ‘The Disaster Recovery Survey 2012: Asia Pacific and Japan’ looks at the state of backup and disaster recovery in the region to understand how well companies are prepared for data loss and systems downtime.

For the full report, visit EMC’s website here.

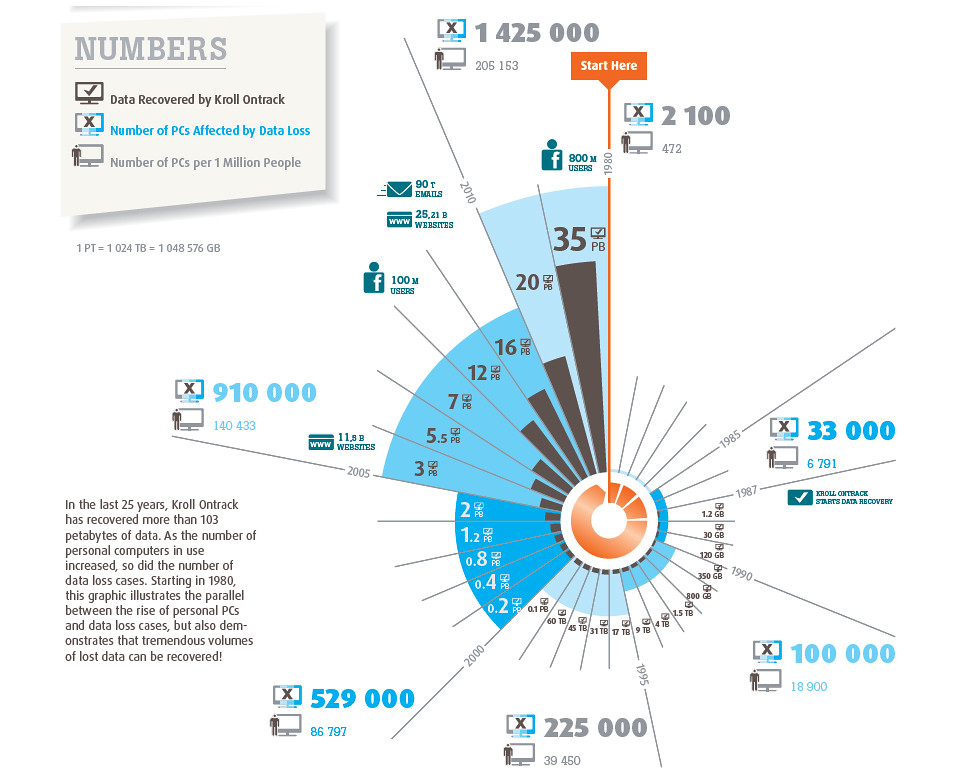
How much data has been created, lost and recovered since the advent of the PC?

Tuesday, March 13th, 2012

Kroll Ontrack has recovered more than 103 petabytes of data over the past 25 years.

THE DIGITAL ERA: How our life has changed into a digital one; and the creation, loss and recovery of data over time (Source: Kroll Ontrack).

THE DIGITAL ERA: How our life has changed into a digital one; and the creation, loss and recovery of data over time (Source: Kroll Ontrack).


Kroll Ontrack
has released new statistics regarding how the creation of storage technologies and digital information has impacted data loss and data recovery technology since the advent of the personal computer in the 1980’s.

“In the past 25 years, the worst cases Kroll Ontrack has seen have coincided with natural disasters, which included burned, water logged and physically damaged drives,” said Todd Johnson, vice president of operations, Kroll Ontrack.Since the first Kroll Ontrack data recovery lab opened in 1987, more than 103 petabytes (PB) of data has been recovered.

How much is 103 PB of data? That’s equivalent to 25 million USB flash drives, each with 4 GB capacity.

Only 1.2 GB of data was recovered in 1987, whereas the amount of data recovered by Kroll Ontrack in 2011 has skyrocketed to nearly 35 million GB (35 PB).

The number of computers impacted by data loss was estimated to have reached nearly 1.4 million – compared to only 33,000 in 1987.

According to an analysis by Kroll Ontrack, the number of data loss cases over the past 25 years grew in parallel with the total number of personal computers in the world.

“One of the company’s most successful endeavors was the recovery of more than 99 percent of mission-critical data from a melted, crashed and burned drive from the 2003 Space Shuttle Columbia,” revealed Johnson.The analysis also revealed that on average, one in one thousand computers lost data stored on it.

In the 1980’s, at the onset of the so-called PC era, the estimated number of personal computers in use was nearly 7,000 devices per one million people and approximately 33,000 of them suffered data loss.

By the mid 1990’s, the number of computers in use was nearly 40,000 per one million people and data was lost from approximately 225,000 computers.

In 2011, these figures reached more than 200,000 computers and 1.4 million cases of data loss, respectively.

“You cannot go through day-to-day life without interfacing with some form of digital data,” said CK Lee, country manager, Kroll Ontrack Singapore. “As technology advances to include virtualization, cloud, and social media, individuals, businesses and of course data recovery specialists have to evolve to address these storage mediums and the new challenges they present.”According to the latest IDC Digital Universe study, the amount of data more than doubles each year, and in 2012, it will exceed 1.8 zettabytes.

This is the equivalent of 200 billion two-hour long HD movies that one person would have to watch continuously for 47 million years.

As data creation increases, so does data loss.

According to a report by market research firm Gartner, every year at least 25 percent of computer users worldwide experience data loss.

Kroll Ontrack statistics indicate that 29 percent of data is lost as a result of hardware failure and 27 percent is due to human error.

Other causes include software errors (7 percent), computer viruses (7 percent) and natural disasters such as floods or fires (3 percent).

Below is a timeline infographic by Kroll Ontrack charting a brief history of the digital era.

(more…)

Dell delivers new data solutions

Friday, February 10th, 2012

Dell improves Fluid Data architecture for more flexibility in meeting the changing demands of organisations, and for increased automation for management of primary, backup and archive data.

Dell has a range of data solutions for SMBs and large enterprises.

Dell has a range of data solutions for SMBs and large enterprises.

Enhancements include new storage backup, application and networking solutions to help SMBs and large enterprises.

“With Dell‟s new primary, archive and backup storage solutions, the Dell Fluid Data architecture delivers the storage intelligence customers need to deal with a sea of constant IT change without driving up costs, wasting time or continually replacing infrastructure.”Dell’s Fluid Data architecture is designed to enable customers to manage more information more effectively.

Specifically, the enhancements include the following:

  • Dell‟s first deduplication backup appliance that integrates intellectual property from the Ocarina acquisition
  • a major software release for Compellent storage arrays
  • a new storage optimization solution for Microsoft SharePoint
  • broader support for Dell Force10, PowerConnect and Brocade storage networking solutions

The solutions are listed below:

  • New Dell DR4000 Storage Platform with Deduplication and Compression
  • New Dell Compellent Storage Center 6.0
  • Dell Compellent VMware vSphere Storage APIs for Array Integration
  • Dell Compellent Storage Replication Adapter (SRA) for Site Recovery Manager 5
  • Dell Compellent vSphere 5 Client Plug-In and Enterprise Manager-vSphere 5 Integration
  • Expanded Support for Dell Force10, Dell PowerConnect and Brocade Storage Networking Solutions

DellAvailability

Currently available:

  • The Brocade 6510 and Brocade DCX 8510 data center switches will be available in January.
  • The Dell Force10 S4810 10Gb Ethernet switch and the deep-buffer S60 1Gb/10Gb Ethernet switches for EqualLogic are currently available.
  • The Dell PowerConnect 8024 10Gb switches and M8024-k Blade IO modules are currently available.

First quarter 2012:

  • The Dell DR4000 disk-based backup appliance with deduplication will be available in Q1.
  • The Compellent Storage Center 6.0 software will be available in Q1.

Detailed descriptions of the solutions can be found in the press release below.

(more…)

CA ERwin solutions enable collaborative modeling for cloud and on-premise data

Monday, February 6th, 2012

Support for SQL Azure, new Web Portal helps stakeholders visualize data assets across the business.

ERwin solutions from CA Technologies

ERwin solutions from CA Technologies

Today’s resource-strapped organizations struggle to manage data complexity and share accurate information as new platforms and increasing volumes of data are added to their IT environments.

With CA ERwin data modeling tools, business and technical users can reap the benefits of a centralized, common view of business data in context.

This enables them to better understand and enforce critical data definitions and more easily leverage information as a strategic asset.

The products are described in more detail below:
(more…)